[ed: bump for epicness. contains swearing, obviously. Wait. What? Oh are you f-ing kidding me about JT Compher breaking his foot. I HATE ALL THINGS.]
THE STATE OF OUR OPEN THREADS: A SEASON IN PROFANITY
We’ve entered December and the relative lull between the end of the regular season for football, bowl games and conference basketball. We have undoubtedly looked back on 2013 and said our peace and expressed our frustrations with how things went this year.
As you know, of course, your frustrations were measured here and compiled into a series of short summaries which began to appear midseason, and this was called “The State Of Our Threads”. I was the originator of the idea, but I actually was not the first to post it because I was a little leery of how people might react to the self-effacing blog humor that it was meant to be. I have CooperLily21 to thank for introducing this initially.
Well, now that the season is over and our thoughts have collected, it is time to look at how we got mad, what made us mad and how often we were mad.
SUMMARY DATA
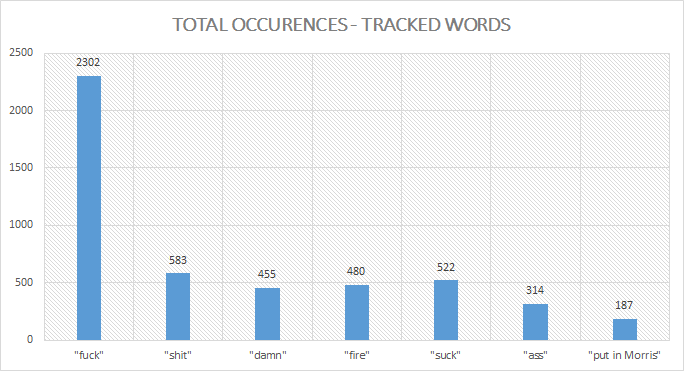
For the same of simplicity, I tracked seven words or types of references. One of them, specifically “put in Morris”, was more for something which will appear in another part of this work. It was a very productive year with 4,843 occurrences of these tracked words and references. All of them as well as their relative frequency of use are in the table and chart below.
| TOTAL | AVERAGE | STD. DEV. | % oF TOTAL | |
| "fuck" | 2302 | 191.83 | 166.49 | 47.53% |
| "shit" | 583 | 48.58 | 27.74 | 12.04% |
| "damn" | 455 | 37.92 | 41.14 | 9.40% |
| "fire" | 480 | 40.00 | 49.37 | 9.91% |
| "suck" | 522 | 43.50 | 32.61 | 10.78% |
| "ass" | 314 | 26.17 | 26.32 | 6.48% |
| "put in Morris" | 187 | 15.58 | 16.81 | 3.86% |
There were some other interesting statistics to report as well.
The average number of instances of the tracked words for a home game, for example, was 256 and for away games, it was 611. In other words, we swore at an average rate 2.38 times greater during our away games than our home games. I am fairly certain our performance in some of those games has a hand in that number.
The average thread size (or combined posting volume in both threads, if there were two) for a home game was 1,283 posts, but for an away game, it was 1,929. As noted above, this is probably due to performance in some of these games which led to some of us having much to say, and per this study, not much of it was kind.
Most interesting of all to me, 70.06% of all tracked swearing was done during away games, compared to only 29.94% for home games. This is sort of given to you in the average per-game comparison above, but the percentages here really paint the picture, I think. In our collective perception, we were not good on the road and here is further evidence of that perception.
One other question you might have is which games contributed most to the total. You probably would not be shocked if I told you that, by themselves, Penn State, Northwestern and Iowa contributed to 55.40% of all instances of the tracked words. Even though one of those was a win, these three games left us the most perturbed.
THE MOOD CHART
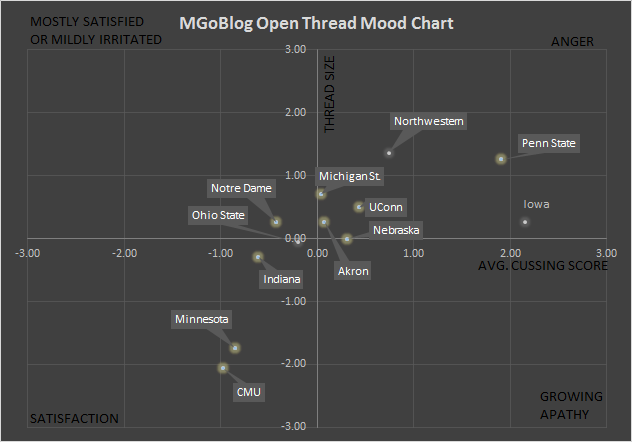
What did the MGoMood look like on a plot? See the Mood Chart below:
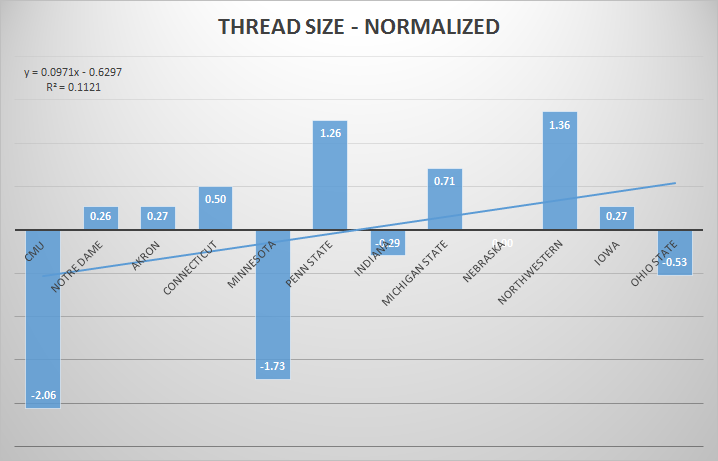
Using the normalized values of each major component – thread size and swearing frequency (I used the average of the tracked words), we get a decent handle on the board’s general mood throughout the course of the football season. As you can see, we spent much of it rather upset, although there were noted exceptions. One thing we can hypothesize here is that the people who threatened to check out and said they would be done with this team probably came to say something anyway, because although Nebraska may have left us feeling the most numb per the graph, we still definitely felt something.
[AFTER THE JUMP: WHAT MADE US MAD, other than everything, and the most MGoBlog stat of all time: swearing efficiency.]
WHAT MADE US MAD?
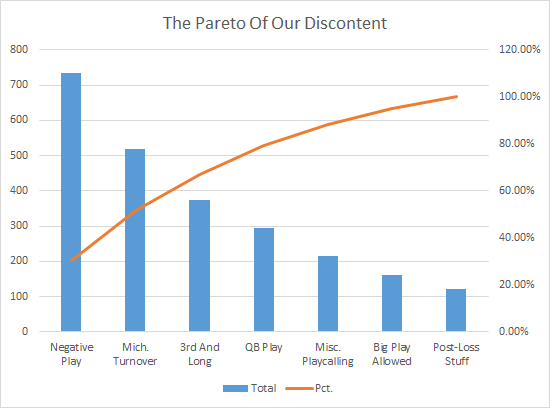
A random sampling of the threads – half of them – and some random categorization provide us with “The Pareto Of Our Discontent”. In the sampling, which involves game from each third of the season, we can start to get an idea of things which made us particularly upset.
“Negative Plays” covers the rushing game as well as general criticisms of run-blocking and play selections for the runs themselves. The lack of success here – at least in the sample – made us angrier that anything really. From here, turnovers, “3rd And Long” (which was a blanket category for long downs on offense), QB play (where the "put in Morris" references come into play, but also criticisms of Gardner alone) and so on. How did we then turn that discontent into proposed action? We shall see.
SWEARING AND THREAD SIZE
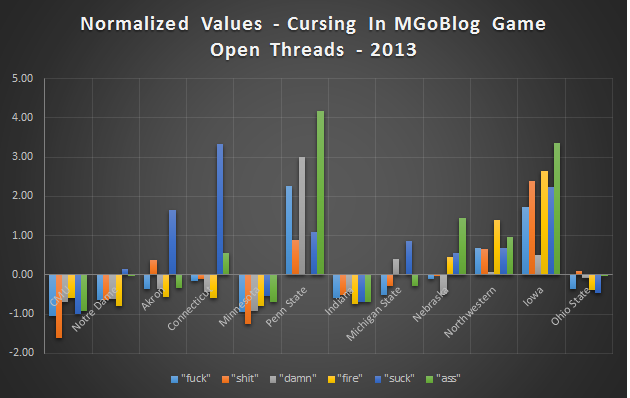
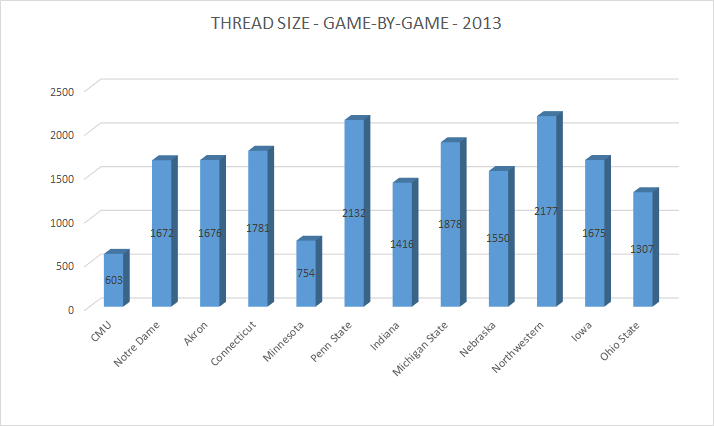
Here are the individual values for each tracked word and thread size normalized to their mean. The mean thread size, so you are aware, was 1,551 posts with a very wide standard deviation of 461 posts.
You have seen the top chart before if you have followed these weekly, which is the normalized values for each tracked word. You will note that by far the most concentrated rage belongs to the Penn State and Iowa games, both of which were quite winnable. Trailing far behind would be Northwestern and Nebraska, and then the board was comparatively mellow after that.
The thread size graph should give you an idea of how much we talked on the board during each game. Far and away, we were at our most talkative during Penn State and Northwestern, with Michigan State being some distance behind. Iowa, for the sort of game that it turned out to be, was not a game were we said so much, but it was what we did say that gives this game a particularly interesting honor. The overall trend was that we talked a little more each game, but as you will note from the R-value, it wasn’t a steady trend.
SWEARING EFFICIENCY
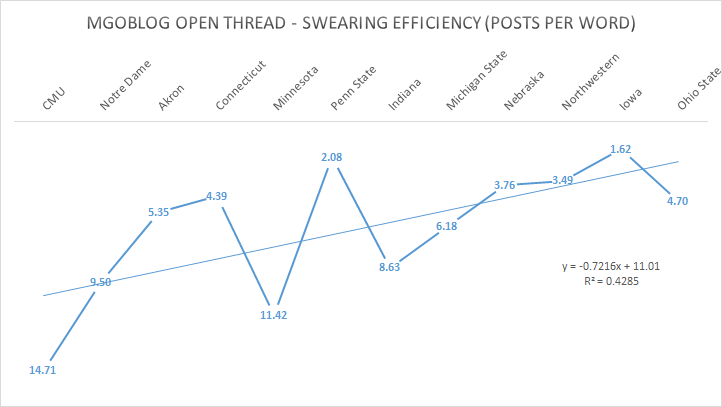
For purposes of this study, “Swearing Efficiency” was the number of posts per instance of a tracked word, so for example, when you see on the chart below an efficiency rating of 14.71 for the Central Michigan game, it means that there was an instance of a tracked word every 14.71 posts in the thread, so it was a relatively clean chat for this game.
The advantage of looking at the swearing here from an efficiency standpoint is that you can see where we as a blog were very concise and pointed in our expressions of disappointment (to put it mildly, in some cases).
The first inklings of concise rage are evident in the trying Akron-UConn stretch, which was followed by relatively clean thoughts for Minnesota. After that, Penn State hits 2.08 and then a crescendo builds slowly to the Iowa game, where we basically lose our shit in the second half.
GENERAL ITEMS YOU WANTED TO KNOW
FIRE SOMEONE, ANYONE
It turns out that a lot of people wanted a lot of things fired this year, some of them things which probably couldn’t be fired or were not leaving in any scenario. Whether it be the mods, a coach or the family dog, there was a lot of firing being proposed. The question a lot of bloggers asked, however, is who we wanted fired in our collective rage.
Of the 480 references to firing someone, 311 of them were directed at one Al Borges, which accounts for 65% of all calls for someone’s head in our open threads. Darrell Funk actually gets off lighter than you might think with another 17% of the calls for termination. The next most popular choice was Brady Hoke with about 12% and Greg Mattison with a very surprising (as in, this is a lot higher than I assumed) 2%. The remaining 4% go to random people and even items – “The Mods” were a popular choice though.
HOW DID WE “FUCK”?
Some people asked about getting data on just how we used “fuck” in particular, and in all 2,302 instances of the word, we spent almost 90% of the time using it either as an interjection or an adjective. In other words, our usage mirrored common usage. Now, most of the remaining 10% actually had people successfully using it as an adverb, so kudos to these people for thinking out of the fucking box.
WHEN DID WE “SHIT”?
When we needed a colorful simile, we went to “shit” often. Actually, far and away, this particular use was the most common. There were a few rare uses of “shit” as an adjective and even an interjection, but when we needed to talk about what the quality of play was like, we knew exactly what to say apparently. MGoBlog is poetic in its use of “shit”, if nothing else.
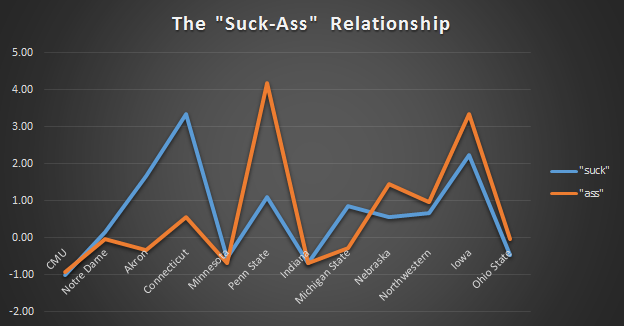
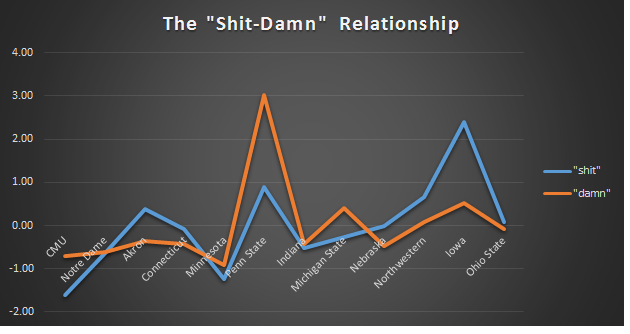
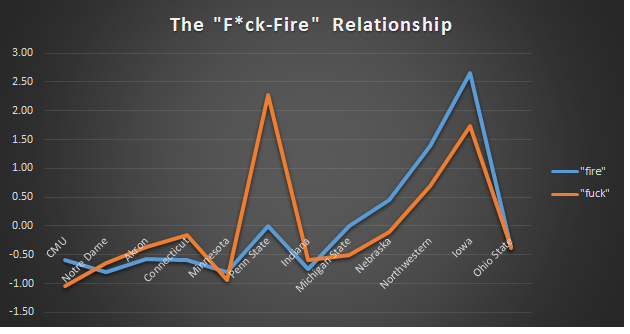
VARIOUS RELATIONSHIPS:
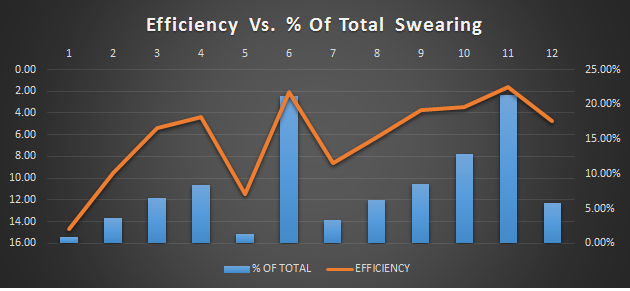
The interplay between selected sets of tracked words can be seen below:
CONCLUSION:
It was a frustrating year on many levels, but here we are in December, a little older and perhaps a little wiser. Some of our friends did not make it through the season, but many of us did. For those who wanted to know in semi-precise detail just how frustrating we believed 2013 to be, hopefully you now have an answer to that question.
