[Patrick Barron]
In the beginning, it seemed like things might change. Michigan’s defense has been giving up more shot attempts than their offense has been generating from the drop, but the freshman class seemed to inject a bit more tenacity into Michigan’s forechecking. Opponents held the puck for long stretches, but it seemed that the prime scoring chances ceded by defenses in years past, the ones right in front of the net, may have been corrected. At least, that’s what this writer naively believed.
We’re now a bit past the midway point in the season and, thanks to some meticulous stat tracking, we have data to lean on that suggests the unchecked-man-in-front-of-the-net problem has not been remedied. An idea that’s gained popularity over the last few years among NHL advanced stats wonks is separating out from which area a shot is attempted. Those analysts have found what one might expect: more goals are scored from the area in front of the net than from the edges of the zone. Below we have scoring chance by shooting location via a Chance article by A.C. Thomas:
Based on information like the above, analysts have started to call the area with the two darkest shades of green the “home plate” area. The success rate above is based on NHL data, but the idea can be carried over to college hockey. With that in mind, David has been tracking shot attempts (in the Corsi sense; shots on goal+misses+blocked shots) all season. (Special thanks to Orion Sang and Mike Persak of the Daily for frequently providing us with shot charts.) Now that we’re past the midpoint of the season and solidly into Big Ten play, it seems that there’s enough data to see how Michigan’s defense has fared. It’s, uh…well, there’s a reason I called myself “naïve” above.
[After THE JUMP: cheery fun stuff]
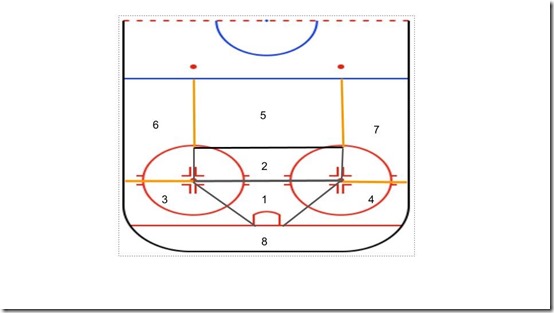
David and I started tracking this information last season, and in that time we’ve settled on breaking down sections of the ice as follows:
Our home plate area includes zones 1 and 2; with two zones we can break things down further into extremely dangerous shot attempts and truly very extremely dangerous shot attempts.
Michigan has been badly out-attempted this season. Their Corsi For % is second worst nationally, a meager 41.3% (and just 0.1% higher than last place Alaska-Anchorage). Over 22 games, Michigan has attempted 1,108 shots and allowed 1,576 shot attempts. In essence, they’ve probably been outshot from almost every region of the ice. Since we’re masochists, we just wanted to look at the most dangerous regions over the 20 games for which we have charts. (Two games were not televised and proved impossible to get charts from no matter which avenue we tried.)
Of all the shot attempts Michigan has allowed this season, 33.4% have come from zones 1 or 2 (the home plate area). At even strength, Michigan’s goaltenders are surrendering goals on 3.75% of all shot attempts. Their goals allowed percentage increase to 10% when looking at just the home plate region. Of all the even-strength goals Michigan has allowed this season, 60.8% have begun as shot attempts from zones 1 or 2. The highest frequency of shots from the home plate area came in the second game of the BU series (45.8% of total shot attempts allowed), while their season low in percentage of shot attempts allowed from home plate (24.4%) has happened twice. It’s also worth noting that they’ve allowed more than 37% of shot attempts from the home plate area in eight of 20 games tracked.
Unfortunately, no college hockey sites seem to be tracking shots with the same level of detail, which means that we don’t have a college-hockey-wide home plate save percentage or home plate shot attempts allowed percentage to compare against. Though we’re not exactly getting ready to present this information at the Sloan conference, it’d be nice to have something with which to compare. We’re instead forced to use NHL data. Rob Vollman’s research indicates that, over a three-season sample, the highest home-plate save percentage was close to .890. If that holds at the college level (where you could argue that both shot quality and goaltenders are worse than in the league), then Michigan netminders’ .900 save percentage on shot attempts from home plate is excellent.
This can be coupled with Goal-by-Goal Analysis as evidence that the problem this season has been team defense, not goaltending. If there’s one thing that you would hope the team can shore up in the second half, it’s making sure everyone’s aware of who’s moving in and through the slot and crease. Michigan’s 16th in the nation in shot attempts allowed, but all the teams above them have played at least 25 games, and most have played 28 or 29.
All told, Michigan’s one of the worst teams in the country at limiting opponent shot attempts. They have allowed double-digit shot attempts from zone 1 in seven of the 20 games we tracked, while they curiously have yet to allow double digit attempts from zone 2. Not only is Michigan allowing too many dangerous attempts, they’re allowing the most attempts from the absolute most dangerous area on the ice. Forwards and defensemen are going to have to stop watching the puck and instead find their man if they’re going to start suppressing shot attempts from zones 1 and 2. Continue to allow 33.4% of shot attempts to come from the most dangerous area of the ice and Michigan’s excellent goaltending will have gone for naught.


