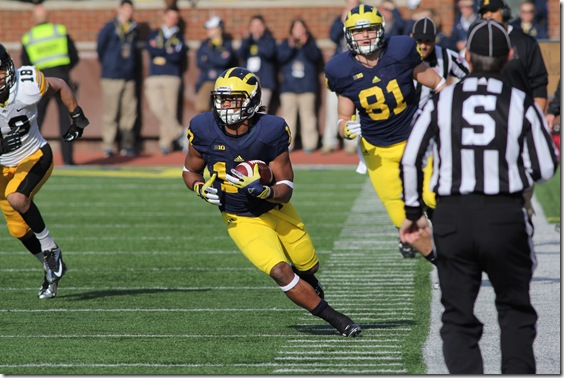
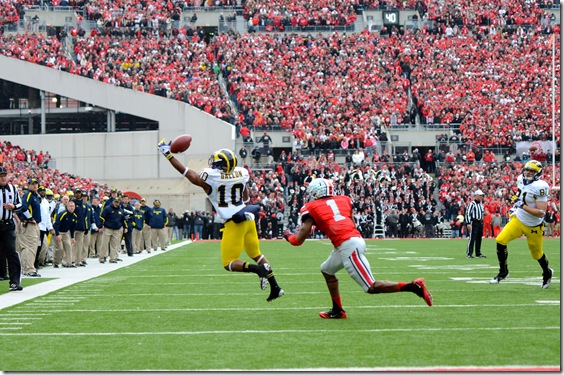
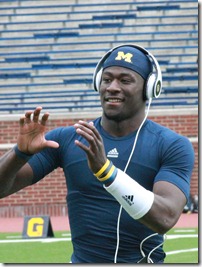
During a wee hours period break of a wee hours Wings game last weekend, I ended up in a conversation about the #1 jersey and who might be the next player to wear it. The guy was really high on Chesson or Drake Harris or some future giant; I was like thatsracist.gif because the best receiver since Braylon is on the roster RIGHT NOW
Upchurch
Unless you’re just categorically against changing numbers for seniors (which I totally understand in all circumstances but this), if we’re truly honoring elite receivers with the 1 jersey it could be time we give it to Jeremy Gallon. The case against: is 5’8, has always been just mediocre at returning punts and kicks, is 5’8, took some time to work his way up the depth chart, would ideally be a slot receiver because he’s 5’8. The case for: is secretly 8 feet tall, among his various Inspector Gadget peripherals is a cloaking device that saved Under the Lights I, and the WAR stat for receivers says he’s the best in the conference by a wide margin.
When I was doing the receivers pages of HTTV last week I went looking for some more advanced stats to put in tables aside from the usual Bentley things like receptions, yards, TDs, games played, and what you can get by dividing those things together. I remembered cfbstats’s Marty Couvillan last year made all of those targeting data available to the public, with an assist from Bill Connelly of Football Study Hall.*
What Marty did is took that play by play ticker information that the NCAA makes available, and through some ninja text-to-columns work, managed to pull out data for when each receiver was targeted. This is groundbreaking work in receiver stats, knowing what happens whenever a ball is thrown in the direction of a player. It still doesn’t say how well it was thrown, how deep if it wasn’t caught, or how many defenders had to be shooed off, but until we have official scorers UFR-ing every game this is about the best we can get. Guys like Bill began building their own stats out of the new data and came up with YRPR, which formula is:
- The % of your team’s targets you receive
- Times how many yards you average per pass thrown in your direction
- Times an adjustment for the rest of your team’s passing game so we don’t just get the guys with great QBs and lines
- Times an adjustment for how often your team passes, so that we don’t just award wide open receivers on run-heavy teams, e.g. Roundtree 2010.
And what it said was…
2012 Big Ten Receivers by YRPR:
| Rk | Name | Targets | Catch Rate | School | Rk (FBS) | YRPR |
|---|---|---|---|---|---|---|
| 1 | Jeremy Gallon | 79 | 62.0% | Michigan | 14 | 169.56 |
| 2 | Jared Abbrederis | 71 | 69.0% | Wisconsin | 22 | 149.32 |
| 3 | Kenny Bell | 77 | 64.9% | Nebraska | 34 | 134.55 |
| 4 | Allen Robinson | 126 | 61.1% | PSU | 36 | 133.27 |
| 5 | Roy Roundtree | 58 | 53.4% | Michigan | 51 | 118.63 |
| 6 | Corey Brown | 85 | 70.6% | Ohio State | 52 | 118.22 |
| 7 | Devin Smith | 58 | 51.7% | Ohio State | 73 | 109.21 |
| 8 | Cody Latimer | 65 | 78.5% | Indiana | 80 | 107.02 |
| 9 | Shane Wynn | 95 | 70.5% | Indiana | 124 | 86.15 |
| 10 | Kofi Hughes | 81 | 53.1% | Indiana | 129 | 84.95 |
| 11 | A.J. Barker | 46 | 65.2% | Minnesota | 150 | 79.71 |
| 12 | Antavian Edison | 92 | 63.0% | Purdue | 165 | 76.67 |
| 13 | Quincy Enunwa | 69 | 60.9% | Nebraska | 180 | 73.28 |
| 14 | Keenan Davis | 88 | 53.4% | Iowa | 193 | 70.45 |
| 15 | Kevonte Martin-Manley | 81 | 64.2% | Iowa | 196 | 70.20 |
| 16 | Drew Dileo | 30 | 66.7% | Michigan | 206 | 67.70 |
| 17 | Jamal Turner | 53 | 60.4% | Nebraska | 216 | 65.02 |
| 18 | Jacob Pedersen | 49 | 55.1% | Wisconsin | 221 | 63.33 |
| 19 | Ryan Lankford | 63 | 58.7% | Illinois | 237 | 59.96 |
| 20 | Kyle Carter | 52 | 69.2% | PSU | 240 | 59.30 |
| … | ||||||
| 27 | Devin Gardner | 37 | 43.2% | Michigan | 271 | 54.41 |
| … | ||||||
| 33 | Devin Funchess | 28 | 53.6% | Michigan | 324 | 47.86 |
I know what you’re thinking: that top five includes three of the receivers I drafted in last year’s Draft o’ Snark, and my fourth is in the Top 10. That and our tiny receiver who looks like Snoop was best in the conference and 14th in the nation. Not “one of the best after Allen Robinson and Kenny Bell and Jared Abbrederis and those Ohio State and Indiana guys,” but best-best.
Nationally Gallon was one spot behind West Virginia’s Tavon Austin, also a 5’8 mite, also the first receiver taken in this year’s NFL Draft. In fact most of the guys above Gallon were drafted this year—only USC’s Marqise Lee, SJ State’s Noel Grigsby, Bama’s Amari Cooper, Vanderbilt’s Jordan Mathews, and Fresno State’s Davante Adams return among those who finished above Jeremy Gallon in this metric.
When Brian gets to the receiver previews later this offseason he will undoubtedly point out that Gallon blew up after Gardner stepped in, projecting to Braylon-like numbers if you extrapolate the Gardner starts across an entire season. Well, the advanced stats guys took his entire year and said he’s Tavon Austin.
* [Where’s LSAClassof2000? Follow those links and stop writing personal diaries.]
[After the jump, how Gallon’s 2012 compared with those of past M receivers, and how the Big Ten has fared against the others]
GALLON: BEST RECEIVER SINCE BRAYLON?
Fuller
Since the stats go back only to 2005 we don’t have any target stats of #1s to compare Gallon to. But what we do have is all three years from 86 and 16, a senior 8, a couple of 15s, and Junior Hemingway. Gallon’s 2012 was the best of them:
Michigan Receiving Seasons Over YRPR of 50.0, 2005-'12
(hover over the headers for explanation of stats):
| Player | Tar | Cth | Yards | CthRt | YPTar | T% | YPC | RYPR | Rk (Year) | Rk (All) |
|---|---|---|---|---|---|---|---|---|---|---|
| Gallon 2012 | 79 | 49 | 829 | 62.0% | 10.5 | 27.1% | 16.9 | 169.6 | 14 | 124 |
| Avant 2005 | 126 | 82 | 1065 | 65.1% | 8.5 | 32.6% | 13.0 | 155.1 | 24 | 185 |
| Manningham 2007 | 142 | 72 | 1174 | 50.7% | 8.3 | 35.8% | 16.3 | 151.6 | 21 | 208 |
| Hemingway 2011 | 58 | 34 | 699 | 58.6% | 12.1 | 21.7% | 20.6 | 143.8 | 39 | 252 |
| Roundtree 2010 | 107 | 72 | 935 | 67.3% | 8.7 | 26.4% | 13.0 | 140.4 | 34 | 280 |
| Roundtree 2012 | 58 | 31 | 580 | 53.4% | 10.0 | 19.9% | 18.7 | 118.6 | 51 | 455 |
| Arrington 2007 | 115 | 67 | 882 | 58.3% | 7.7 | 29.0% | 13.2 | 113.9 | 68 | 518 |
| Manningham 2006 | 64 | 38 | 703 | 59.4% | 11.0 | 20.4% | 18.5 | 108.4 | 75 | 614 |
| Breaston 2006 | 87 | 58 | 670 | 66.7% | 7.7 | 27.8% | 11.6 | 103.3 | 87 | 689 |
| Stonum 2010 | 80 | 49 | 633 | 61.3% | 7.9 | 19.8% | 12.9 | 95.0 | 110 | 824 |
| Gallon 2011 | 42 | 31 | 453 | 73.8% | 10.8 | 15.7% | 14.6 | 93.2 | 103 | 866 |
| Hemingway 2010 | 56 | 32 | 593 | 57.1% | 10.6 | 13.8% | 18.5 | 89.0 | 123 | 952 |
| Arrington 2006 | 58 | 40 | 544 | 69.0% | 9.4 | 18.5% | 13.6 | 83.9 | 142 | 1074 |
| Roundtree 2011 | 49 | 19 | 355 | 38.8% | 7.2 | 18.4% | 18.7 | 73.0 | 164 | 1389 |
| Roundtree 2009 | 46 | 32 | 434 | 69.6% | 9.4 | 15.1% | 13.6 | 68.0 | 203 | 1538 |
| Dileo 2012 | 30 | 20 | 331 | 66.7% | 11.0 | 10.3% | 16.6 | 67.7 | 206 | 1548 |
| Manningham 2005 | 48 | 27 | 442 | 56.3% | 9.2 | 12.4% | 16.4 | 64.4 | 198 | 1664 |
| McGuffie 2010 | 39 | 39 | 384 | 100.0% | 9.8 | 9.6% | 9.8 | 57.7 | 239 | 1947 |
| Mathews 2009 | 55 | 29 | 352 | 52.7% | 6.4 | 18.0% | 12.1 | 55.1 | 272 | 2068 |
| Gardner 2012 | 37 | 16 | 266 | 43.2% | 7.2 | 12.7% | 16.6 | 54.4 | 271 | 2116 |
| Odoms 2008 | 90 | 49 | 445 | 54.4% | 4.9 | 29.7% | 9.1 | 52.7 | 273 | 2222 |
| Koger 2011 | 35 | 23 | 244 | 65.7% | 7.0 | 13.1% | 10.6 | 50.2 | 302 | 2359 |
Better than any Manningham campaign. Better than Avant’s senior year. Better than Roundtree’s 2010 season. Seeing Tree all over this chart however does give you pause, since we are all consensus’d that while Roy was an effective guy we were quite happy to have, the nature of the offense created a lot of his stats, and putting him on the list with legendary #1s might have been a bit of a stretch. With Roundtree you can see the dip from 2010 to 2011 in catch rate: two thirds of balls thrown in his direction were receptions his last year under Rodriguez, then he caught less than two in five his first year in Borges’s offense. But then Northwestern!
You also might think a guy wearing the 1 jersey would have something like Manningham’s 36% or Avant’s 33%, but I think that’s more a mark of the offense than the player; I would rather there be other targets. Anyway I’m sick of the #1 being de facto retired while we hand out 21 to guys nothing like Desmond Howard. Meanwhile my brain doesn’t need to do backflips to process 10 as 1 (like it did when Roundtree went to 21 and Gardner went to 12, and I was constantly all “when did Roundtree gain 40 lbs and 4 inches?”). And it’s not like people are gonna say “Nice Gallon jersey” if you’re wearing 10 around the stadium, you know?
BONUS: BIG TEHNNN!!!?
While we’re in here I wanted to see how the conference fared, since early last season I wrote a pretty scathing preview of the Big Ten’s receivers in this space. Here’s a comparison by YRPR the Top 30 receivers in each conference last year:
Average YRPR of Top 30 Receivers in Each Conference, 2012 season:
| Conf | Top Ten | 11-20th | 21-30th | Top 30-All |
|---|---|---|---|---|
| SEC | 166.61 | 94.53 | 77.53 | 112.89 |
| Big 12 | 157.99 | 94.26 | 55.38 | 102.54 |
| ACC | 128.57 | 82.41 | 63.23 | 91.40 |
| Pac-12 | 143.23 | 75.00 | 53.18 | 90.47 |
| Big Ten | 121.09 | 68.56 | 55.91 | 81.85 |
| Sun Belt | 112.19 | 73.35 | 50.46 | 78.67 |
| MAC | 109.36 | 73.43 | 48.45 | 77.08 |
| Mountain West | 110.67 | 68.38 | 51.99 | 77.01 |
| Big East | 109.97 | 68.25 | 47.74 | 75.32 |
| C-USA | 99.03 | 66.09 | 51.07 | 72.07 |
| WAC | 116.06 | 55.99 | 32.58 | 68.21 |
Worst of the Big Five conferences by a good margin, and far closer to the Sun Belt, the MtnWest, or the MAC than the ACC or Pac12. Our top group of Gallon, Abbrederis, Bell, A-Rob, Tree, two Bucks and three Hoosiers was a little less productive than the ACC’s equivalent, but then the ACC got nearly the same production from their 25h best guy as the Big Ten got from our 16th most effective guy, who incidentally is Drew Dileo. In a down year for receivers across the country, Big Ten receivers sucked.
This seems to have just been a down year, not a trend. The data go back to 2005, over which period the Big Ten is 2nd to the SEC in this statistic:

| Conference | 2005-’12 avg |
|---|---|
| SEC | 109.0 |
| Big Ten | 97.3 |
| Big 12 | 93.6 |
| Pac-12 | 92.7 |
| ACC | 87.2 |
| Mountain West | 85.4 |
| C-USA | 84.3 |
| MAC | 80.8 |
| Big East | 74.7 |
| Sun Belt | 61.8 |
| WAC | 47.5 |
Of 2011’s Top 10 players in YRPR, the conference returned the best (Abbrederis) and the 10th (Keenan Davis). Lost were Nick Toon (235.37), Marvin McNutt (196.27), B.J. Cunningham (190.33), Jeremy Ebert (167.16), A.J. Jenkins (161.01), Junior Hemingway (143.81), Da’Jon McKnight (142.24) and Keshawn Martin (113.85), plus everyone at Penn State. Gallon was 11th.
