[Upchurch/MGoBlog]
Welcome to the first 2016 edition of Moving the Stati-Sticks, our weekly deep-dive into the advanced stats that have become increasingly popular in college football and the weekly in-season post that you most likely forgot existed. I’m hoping to change that this season. Instead of a bunch of tables or numbers in text, I’ll be creating graphs (and they’re mostly intelligible!) for items of note. This won’t be an exhaustive look at every single line item in the advanced stat profiles that are out there, but rather items of interest spun out of last week’s game, followed by a quick look ahead to Saturday’s opponent.
We’ll start with a thousand-foot view of Michigan, and the view’s pretty nice, actually. ESPN’s FPI predicts Michigan’s record will be 10.8-1.7 with an 11.9% chance they win out and a 39.9% chance they win the conference. Bill Connelly’s advanced stats profile at Football Study Hall, from which most of the rest of this post is derived, gives Michigan a 9% chance to win out and 35.2% chance to finish 11-1 or better. Brian Fremeau’s FEI doesn’t have opponent-adjusted stats available yet, but Michigan’s first in the country in unadjusted game efficiency. They’ve also played teams that FEI ranks as either below average (ranked 71-90) or awful (ranked lower than 116), but, uh, wooo we’re number one. More detailed stats are obscured by a lot of garbage time, but on a macro level available projections are very favorable to Michigan.
[After THE JUMP: the run game, quantified]
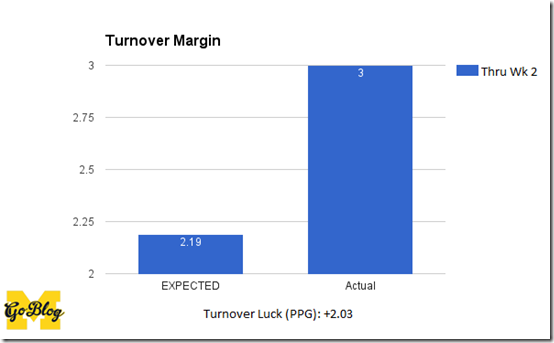
[Turnovers are one of the five factors, but they didn’t fit neatly on the above graph. I split them out on their own instead.]
First, a quick note on the structure of the Five Factors graph: offense is on the left, national average in the middle, and defense on the right. Ideally the blue “offense” bar would be higher than the red “national average” bar, and the yellow “defense” bar would be lower than the red “national average” bar. After all, you want your offense outperforming the average and your defense holding opponents below it. So far, so good for Michigan; all four of the stats that are split into offense and defense hit the aforementioned heuristic.
The offense’s excellent field position won’t come as much of a surprise considering the tipped punts last week. The opposition’s starting field position (25.3) also isn’t a huge surprise considering Michigan is averaging 6.71 points per trip inside the 40 (Finishing Drives) with 10 touchbacks on 20 kickoffs and a 17.2 yd/kick return average. Michigan’s 6.71 pts/trip inside the 40 is worth highlighting again; keep in mind that we aren’t looking at red zone scoring here. Michigan’s been notching almost a touchdown every time they breach the 40-yard line; this is made all the more incredible when considering that these stats don’t count garbage time, which started less than a minute into the second quarter after a Kenny Allen field goal and in which Michigan went on to score 27 more points.
What stands out most to me through two weeks—and, to be fair, it’s more because of the spectacle than because it’s necessarily telling for the rest of the year—is the defense’s Efficiency. Michigan is limiting opponent’s Efficiency (measure via Success Rate) to a paltry 10.5%. Success Rate is basically just a measure of whether a team stays in favorable down-and-distance situations; do they pick up half the necessary yardage on first down, 70% on second down, or 100% on third/fourth down? That means the defense is knocking opponents off the rails 89.5% of the time. To be fair, it’s literally impossible to top the defense holding an opponent to the 0.0% Success Rate they did against Hawaii, but to hold opponents to 10.5% through two games when the national average is 40.2% is pretty dang impressive.
One thing I thought should be discussed after the UCF game is the run game, as I was next to Ace in the press box as his mentions turned into a column of goo, a stream of magma packed with glowing red takes. Was the run game worse than week one? Sure. Is it something to freak out about? Not yet.
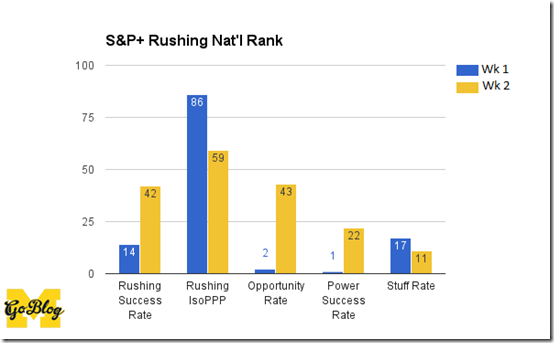
Success Rate did take a dip, but a 48.4% Success Rate is still over seven percent above the national average. IsoPPP, a measure of explosiveness, actually improved; this is a stat where it would be nice to have a full two games of data to confidently explain why that happened, but better to be in garbage time than a close game with an inferior opponent. (Looking at you, Clemson and Georgia and Michigan State.) Opportunity Rate and Power Success Rate both tumbled quite a bit, but we should probably get some context before condemning the run game by looking at…
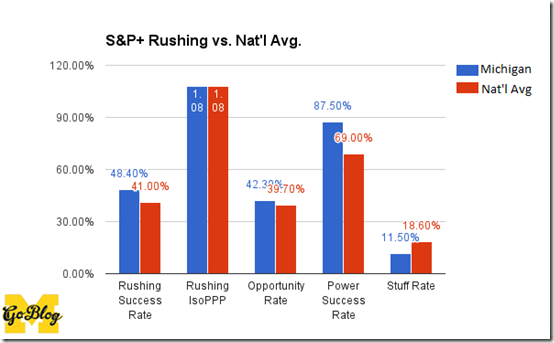
…the percentages relative to the national average. Again, Opportunity Rate is a measure of how frequently the offensive line gets five or more yards for the running back. Michigan’s just a tick above the 39.7% national average at 42.39%, but 1) the not-full-games caveat still applies and 2) freaking out about a 20% drop in Opp. Rate is unwise when the baseline was established against Hawaii, whose rush defense categories are all ranked in the triple digits with the exception of Rushing Success Rate, which checks in at a whopping 94th. Michigan was so good against Hawaii and Hawaii is so bad that the stats dovetailed with the general excitement for 2016, and that left us with a bunch of stats that weren’t particularly revealing. I didn’t even write a Stati-Sticks post last week because there wasn’t anything worth discussing.
What we do know is that Michigan’s Power Success Rate remained way better than the national average, and Stuff Rate actually improved from week one to week two. In other words, Michigan can grind out a couple of yards when they absolutely have to (Power Success Rate) and they’re not getting hit in the backfield (Stuff Rate). I looked through the play-by-play stats out of curiosity, and Michigan converted three of four Power Success opportunities during garbage time; at this point, a big week-to-week fluctuation is mostly attributable to small sample size. There are legitimate concerns with the left guard spot, but if the run game was as bad as some of the hot takists thought it was Success Rate, Power Success Rate and Stuff Rate would be much worse than they are.
From what we can tell, Michigan’s operating a better-than-average run game. The problem—or, more accurately, the “problem”—is that the above is based on two and 1/3 quarters of information. Connelly’s projected margin of victory for Michigan is 25.1 this weekend. If that pans out then some stats are going to get thrown out once again, but any additional information will help us get a better read on how to project this offense across the rest of the schedule.
Looking Ahead
Michigan’s defensive backs are about to get their first true test, with or without Jourdan Lewis. As Ace mentioned in FFFF, Colorado loves the short passing game, and so far this season that’s the lifeblood of their offense. They’re currently ranked first in the nation in offensive Success Rate and fourth in the nation in passing Success Rate. They’re 79th in IsoPPP, a measure of how explosive an offense is when they’re successful (in terms of Success Rate), and 124th in Rushing IsoPPP. The damage Colorado does is likely to come through the air; with many screens expected, crease/alley integrity is going to be big.
Colorado’s defensive stats, at least in terms of Bill Connelly’s Five Factors, are pretty shiny. It would be a tad bit concerning if they weren’t; they’ve played Colorado State, currently ranked 93rd in S&P+, and Idaho State, an FCS team. The one thing that’s worth noting is Colorado’s rush defense, which might not be all that great. They’re a meh 46th and 48th in Rushing Success Rate and Rushing IsoPPP, but their Opportunity Rate, Power Success Rate, and Stuff Rate are a woeful 109th, 108th, and 126th, respectively. Opportunity Rate is the percent of runs where the offensive line gets at least five yards for the runner; a poor Opp. Rate means that Colorado’s defensive line is getting stuck on blocks, an issue Ace noticed in FFFF. Power Success Rate as low as the above hints that they aren’t great in short-yardage situations (to be fair, I’m not sure how many of those they’ve faced). A Stuff Rate that low, however, is even more evidence that they can’t get through opposing offensive lines to make a stop in the backfield, and they haven’t exactly faced a bunch of gentlemen you’d naturally describe with heavy equipment analogies. Michigan should be able to run on these guys.


