The Michigan Difference: seeking input on offseason article topics and the first request being about punting and then getting a quick second! Ask and you shall receive.
MGoUser stubob asked whether or not outkicking the coverage on punts was a real thing and if there was an optimal distance to kick the punt. To look at this I looked at all “returnable” punts. Punts kicked from at least the 20 yards and that did not go further than the opponent’s 10 yard line and occurred in the first half of the game unless otherwise noted.
The Mode
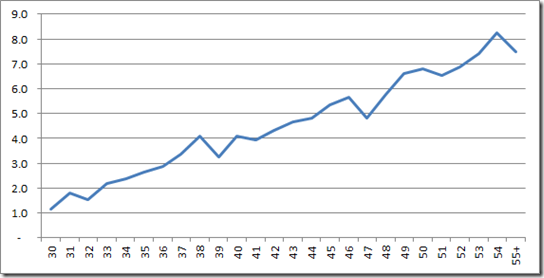
Unsurprisingly from the original hypothesis, the longer the punt, the longer the average punt return.
Average return yards/punt given punt distance
Initially, it does look like longer punts yield longer returns. Of note though is that the slope is significantly flatter than a 1 for 1 trade. The rough slope is that for every four yards of distance you add to the punt, you give back a single yard of average return (not counting touchbacks). This accounts for the average case, but doesn’t address the risk and variance.
The Big Return
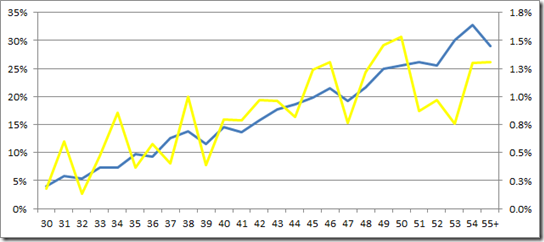
Percent of returns going 10+ yards (Blue) and for TDs (Yellow)
Again, the data backs up the conventional wisdom on long punts. A 55+ yard punt has a one in four chance of coming back at least 10 yards. With an average return of 7+ yards this isn’t much of a surprise. The longer returns aren’t just a function of more space between the punting team and the return team. But even with smaller sample sizes, there is a strong trend between likelihood of a touchdown and the length of the punt. Even though the total odds of a 55+ yard punt getting returned for a touchdown is about 1 in 75, that is about 3 times the rate of a 30-35 yard punt.
Strategy Implications
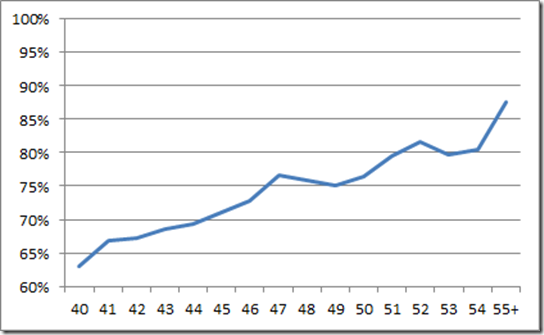
If you look at the net implications of these two charts, the long term strategy clearly points to kicking it as far as you can, concerns be damned. Even when you factor in touchbacks, the odds of a punt netting 40 yards goes up dramatically the longer the kick.
Percent of punts netting 40+ yards by punt distance
55+ yards net over 40 yards nearly 9 out of 10 times, nearly 50% more than a 40 yard kick. Outkicking the coverage isn’t a valid enough fear to push for any decision other than kicking it long, except possibly in a late game situation where the small but increased risk of a touchdown on the return becomes more highly leveraged.
The Spread Punt
One of the few questionable decisions the Hoke era has produced has been the refusal to move to the spread punt. While I don’t have data on which teams have converted to the spread punt when, but if you trend punting data over the last 10 years, its clear that something is happening.
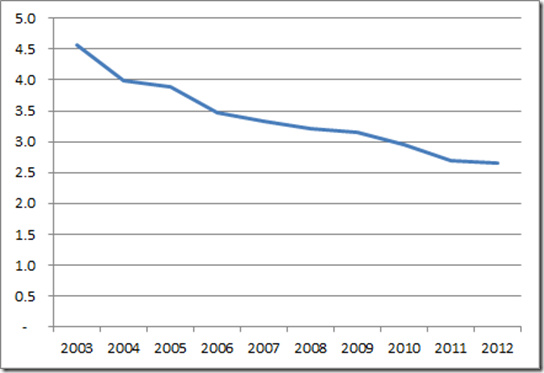
Average return yards per punt by season, excluding touchbacks
Over the last ten years, the average return yards per punt has decreased by 42%.
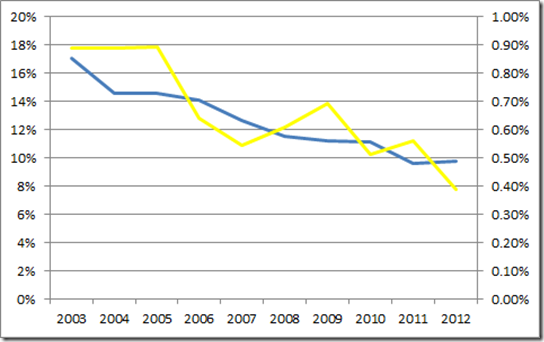
Percent of punts returned 10+ yards (Blue) and TDs (Yellow)
Just like above, the move towards lower return yards corresponds with a lower rate of long returns. The real indication of change comes next.
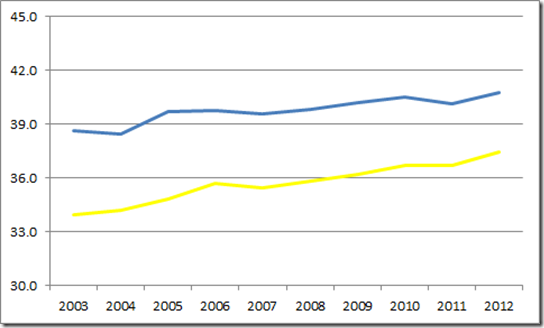
Gross (Blue) and Net (Yellow) punting (including touchbacks)
This generally otherwise uneventful chart shows that over the last ten years both gross and net punting have improved nearly every season. Not only has net punting improved, but it has improved at a rate faster (10.3% cumulative) than that of the gross punting (5.6%), which is the exact opposite effect you would expect based on the fundamental connection between punt distance and punt return yardage. This indicates that over the last 10 years there has been a shift in the basic nature of both the punt and the punt return. Correlation and causation and all that, but this is a pretty clear indicator that the widespread adoption of the spread punt formation has been a huge win for the punting teams.
If we make the weak but directional assumption that 2003 = Traditional Punt and 2012 = Spread Punt, the formation is worth about 3.5 yards per net punt and a 50% reduction in punt return touchdowns. Otherwise of note is that the block rate has dropped along a similar slope from 2.6% in 2003 to 1.0% in 2012. So net punting up, gross punting up, punt returns down, punt returns touchdowns down and punt blocks are down. Whatever has happened between 2003 and 2012 let’s hope Michigan is on board.
