Now that we’ve officially entered the dead period after Spring Ball and before Fall Camp, its time to start digging into some of the details. As always if you have something you want me to look into hit me up in the comments or on twitter.
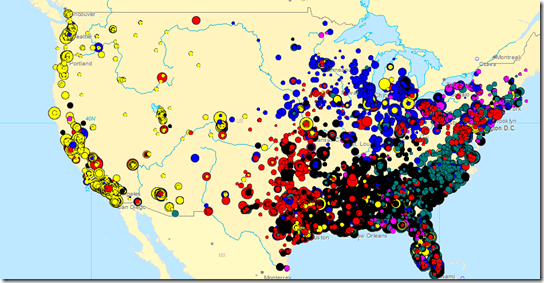
Using some new software and my recruiting database, I wanted to see what the recruiting scene from the last 12 classes (2002-2013) look like on a map. Each BCS conference signee is shown with a dot and scaled to represent the consensus rating of that recruit. The larger the dot, the more highly regarded the recruit was. Metro areas have tons of recruits piled on top of each and are difficult to distinguish, but I think there are plenty of interesting things to pull from the overall picture.
The National Overview
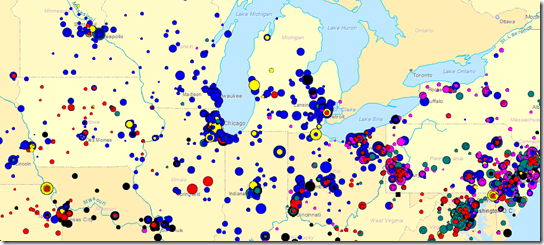
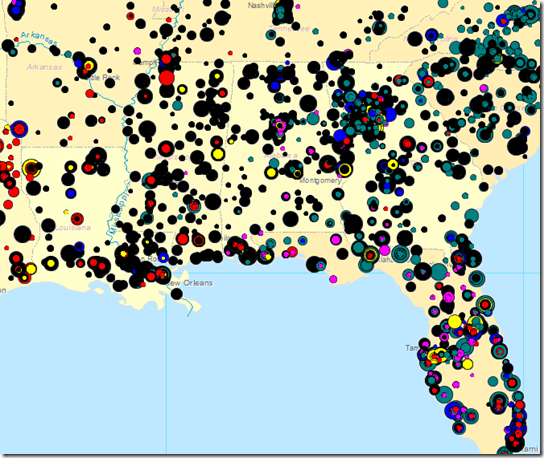
B1G=Blue, SEC=Black, B12=Red, P12=Yellow, ACC=Teal, former Big East=Pink
Unsurprisingly the recruits center largely around the geographies of the schools they are attending. Florida is a jumbled mess across all of the conferences but there are very clear boundaries by conference. It is also amazing that other than Phoenix, Salt Lake City, Denver and west Texas there are essentially no FBS football recruits between the Pacific coast and I-35. It will be interesting to see what happens with this as geographical boundaries continue to overlap with the ongoing conference expansion.
B1G and SEC Country
The B1G Footprint
Although the Big Ten footprint has largely stayed at home to play, there are regions that have had some pull from outside conferences. Iowa is naturally split and the Big 12 has pulled a few other players from Illinois, Ohio and Pennsylvania. The Pac-10/12 has scored a couple of big Midwest recruits themselves and Eastern Ohio/Western Pennsylvania is a natural ground for competition between the Big 10, Pitt and West Virginia.
Even excluding Florida, the SEC looks to have held their territory about as well as the Big Ten has. The most striking thing to me, is how much coverage the SEC has across its geographic footprint. In the Big 10 there are areas of high population/recruit density with a fair amount of space between them. In the Southeast there are black dots everywhere. It appears as if every county is generating major college football recruits, not just the major metro areas.
[After the jump, a cartographer's dream]
B1G By School
Looking just at the Big Ten teams in the Big Ten footprint, Michigan is probably the team with the widest range. The combination of program prestige and a quality but insufficient home state talent base is likely the source of Michigan's wider footprint. The Buckeyes can generate enough talent in state that the need to extend the boundary is less. Penn State has natural tie-ins east and most of the other teams in the conference haven’t had.
B1G Recruiting the State of Michigan
Michigan has pulled most of the major circles from outside of the Detroit metro while Michigan State has signed most of the second level rated players. The random black circles in the middle of the state represent Doug Van Dyke and Garret Bushong signing with Purdue in 2003.
Michigan success across the rest of the state is easy to see visually but Detroit is tough to distinguish as most of the circles are piled on top of each other. To clarify what Detroit looks like I put together this chart of the top 100 Michigan recruits since 2002. Going left to right by consensus rating, it looks at how many recruits where signed by Michigan, Michigan State, other Big Ten schools and then all other schools.
Within Detroit, Michigan has really pursued the top 33 recruits, or about the top 3 in a given year. For reference, the 33rd ranked Detroit recruit since 2002 is 2013 Michigan signee Khalid Hill. Michigan State has also pursued a similar group. Of those 33, Michigan signed 15 players, Michigan State signed 9 and other schools have also signed 9. LSU, USC, Oregon, West Virginia and Notre Dame have all signed top level Detroit talent from outside the Big Ten while Iowa (2), Ohio State and Illinois have all done the same from within the conference.
B1G Recruiting the State of Ohio
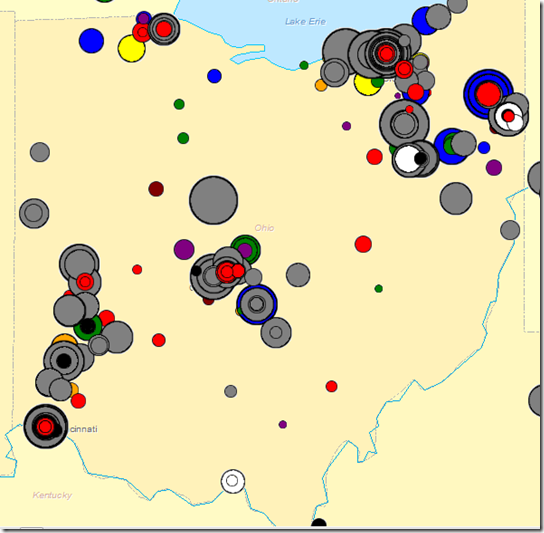
Lots of big gray circles on this one. Tressel was quite successful in locking down the top talent in Ohio. During his tenure, he signed 33 of the top 50 players from Ohio and Michigan signed 5. Like Detroit, the local concentration is difficult to show the nuance of what is happening, so here is a statewide look at the top 500 recruits from Ohio.
Based on the flattening at the, Michigan and Ohio were probably only looking at the top 250 or so recruits, about 20 per year. Of that group, Ohio grabbed about 50% (and a higher rate of the truly elite). Michigan managed about 15% with the rest scattered around a host of schools. Notre Dame (15) and Michigan State (12) where the only other schools with more than 6 signees from the Ohio top 250 from 2002-2013.
But what happens when you look at just Hoke’s full seasons.
The 2012 and 2013 classes shifted things dramatically. Michigan and Ohio were nearly toe to toe through the top 50 and Ohio’s share overall went down considerably. From all indications, the 2014 will look more like the long term trend than the last two. Michael Ferns might be Michigan’s only elite Ohio signee.
As a final look, here is Michigan’s national map. Highly concentrated in Michigan with a strong presence throughout the major Big Ten hot spots and various key other pockets throughout the country.
-----------------------------
*Maps generated by software from Ann Arbor based Llamasoft


