[Adam Glanzman]
“Sometimes, there's a man, well, he's the man for his time and place. He fits right in there. And that's the Dude, in Los Angeles… But sometimes there's a man, sometimes, there's a man. Aw. I lost my train of thought here. But... aw, hell. I've done introduced him enough.” –The Stranger, The Big Lebowski
In mid-2010 I got hired by a bank to be a Customer Service Representative teller. This put me on the front lines of the never-ending war between people’s money and the financial organizations that hold it. I learned very quickly that there were two things that could turn a mild-mannered citizen into a venom-spewing troglodyte: bank fees and Rich Rodriguez.
I loved when people came into the bank wearing college gear because it meant I’d be able to easily strike up a conversation about football, and people are a little less likely to verbally assault you when you’re able to find some common ground. The operative word in that last sentence is “little,” but I digress. By the fall of 2010 people were so fixated on the abject disaster that was Michigan’s defense that they willfully ignored how incredible the offense was. This was the fuel they needed to turn the “RichRod isn’t a ‘Michigan Man’” fire into a raging inferno, and it got so out of control that I talked to people who were even criticizing Rodriguez’s wife for not being Michigan-y or Michigan-ish or something crazy like that. At one point someone complained to me about her having blonde hair.
The Microscope of Public Scrutiny was so zoomed in on Rodriguez and everything surrounding him that Dave Brandon was able to make the Free Press look stupid and then lie in wait. At some point in 2010 Brandon’s opinion aligned with the bank’s clients; to them, the Rodriguez experiment had failed. Enter: Brady Hoke.
Hoke represented everything that the anti-Rodriguez movement wanted: familiarity with the program, a defensive background, and the mixture of self-oriented humility manifest in his claim that he’d walk across the country for the job and the program-oriented bravado in the interminable fergodsakes claim.
The honeymoon phase lasted a full season, but by the end of Hoke’s fourth year the program was in a place similar to where he found it, a place all too familiar to Michigan’s fanbase. One side of the ball was above average, but the other side was in such shambles that the team collapsed under the dead weight.
**********
"Once we get the power play down, then we'll go to the next phase. You know, because we're gonna run the power play."
Brady Hoke, 3/23/2011
The transition from Rich Rodriguez to Brady Hoke was like switching from cold brewed coffee to run-of-the-mill drip coffee; a move away from the newer, higher-octane movement and toward what felt more traditional, the tried and true. The fallout from this was immediately apparent in the speculation that one of the most dynamic players to every don the winged helmet might transfer to a school with an offense better suited to his talents (i.e. a school that wouldn’t put him under center and have him hand the ball off).
In what may be one of the most significant events in program history (more on that later), Denard stayed. Al Borges still tried to put Denard under center and Michigan did rep power, but there were enough zone reads incorporated to allow Denard to continue waking up opposing defensive coordinators in cold sweats. You know all of this. You watched it unfold. That also means you watched crimes perpetrated against manpanda and an offense hell-bent on skinning its forehead running against a brick wall before finally, mercifully, abandoning their MANBALL-big-boy-football-noises ideals and exploding out of the shotgun.
This piece is intended to be the counterpoint to the memory’s emphasis on the spectacular. The intent isn’t to accuse, but to take a more calculated look at what exactly happened to Michigan’s offense over the last four years and see where things went well, as well as where and how things stopped functioning.
[After THE JUMP: charts and tables]
First things first: a note on the stats I’m using. Most of what I’ll present here comes from Bill Connelly’s work, whether at Football Study Hall or Football Outsiders. The rest comes from Brian Fremeau of Football Outsiders. Connelly developed S&P+ (the + just means the stats are opponent adjusted), while Fremeau developed FEI, a drive-based metric. S&P+ uses play-by-play data, while FEI uses drive data. Taking the two together gives us F/+.
Connelly’s use of play-by-play data allows for the creation of some measures that try to account for down-and-distance in an offense’s performance, namely in Standard and Passing Downs S&P+. Connelly defines a passing down as second-and-eight or greater, and third or fourth down with five or more yards to go.
Connelly also filters out garbage time from all of his calculations, which he defines as:
A game [that] is not within 28 points in the first quarter, 24 points in the second quarter, 21 points in the third quarter, or 16 points in the fourth quarter.
Fremeau’s FEI also filters out garbage time, but I wasn’t able to find an exact definition of what he considers garbage time outside of first-half clock kills and end-of-game “garbage drives and scores.”
Having a stat that combines S&P+ and FEI is useful for getting a feel for a team’s overall performance, but it doesn’t cover some of the more specific things on each side of the ball. F/+ stats don’t exist for offense and defense independently, nor do they exist for things I use either S&P+ or FEI for below (i.e. standard or passing down statistics).
I also included 2010 to give a reference point for where the offense was before Hoke arrived. This turned out to be very depressing. If one of you invents a time-traveling DeLorean for the sole purpose of going back in time to stop Rodriguez from ever even considering hiring GERG I’ll know you read this piece.
**********
On last weekend's scrimmage:"Physical nature was good on both sides of the ball.” Saw ability to create big plays, but too many self-inflicted wounds. We have to remedy that before we play. "When you're transitioning offenses -- and trust me guys I've done this a bunch, OK? -- you can survive if the damage you do (to yourself) is not excruciating ... you're going to have some pain, but if those aren't things that are catastrophic, you can survive."
Al Borges, 8/25/11
The trends in Rushing and Passing S&P+ reflect the general assessment most of us have had over the last four years: diminishing production, with the running game reaching its nadir in 2013 and the passing game in 2014. Michigan was ranked second in Rushing S&P+ in Rich Rodriguez’s final season, and the offense essentially picked up where it left off in 2011, ending the season ranked fourth. The precipitous decline happened between 2012 and 2013, when Michigan went from being ranked 14th to 74th.
The passing game really didn’t fall off a cliff until after Borges was fired, ranking 13th, 11th, and 25th in his three years, respectively. In 2014, however, the passing attack ranked 72nd. But hey, the run game was up to 57th! Hooray for silver linings. Or not.
A reminder: Connelly defines passing downs as second-and-eight or more, third-and-five or more, and fourth-and-five or more. Standard downs include first downs and anything closer than the parameters for a passing down.
The trends in Michigan’s Standard vs. Passing Downs S&P+ are less apparent than the trends in the Rushing and Passing S&P+ graph; national rank tells the story better. The offense held things together relatively well for Hoke’s first two seasons before things took a nose dive in his final two. This coincides with the offense’s transition away from using dilithium as its primary power source.
Also of interest is how good Michigan was on passing downs until 2014. It’s not that surprising that Michigan was ranked fifth in 2011; Michigan often fell behind before removing the MANBALL constraints and letting Denard run and heave the ball up. (You’ll see a table later that shows Denard’s downfield success rate and it wasn’t very good; 2011 was a lucky season, from the fumble recoveries to the success on passing downs.)
| Year | Std. Downs S&P+ | Pass. Downs S&P+ |
| 2010 | 5 | 5 |
| 2011 | 12 | 5 |
| 2012 | 13 | 20 |
| 2013 | 57 | 32 |
| 2014 | 51 | 102 |
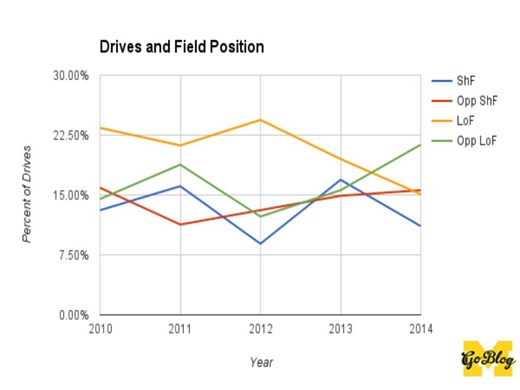
A key for the below graph, via Fremeau:
- ShF: Short Field Drives, the percentage of offensive possessions started at midfield or on the opponent's side of the field.
- Opp ShF: Opponent Short Field Drives, the percentage of opponent offensive possessions started at midfield or on the team's side of the field.
- LoF: Long Field Drives, the percentage of offensive possessions started inside the team's own 20-yard line.
- Opp LoF: Opponent Long Field Drives, the percentage of opponent offensive possessions started inside the opponent's own 20-yard line.
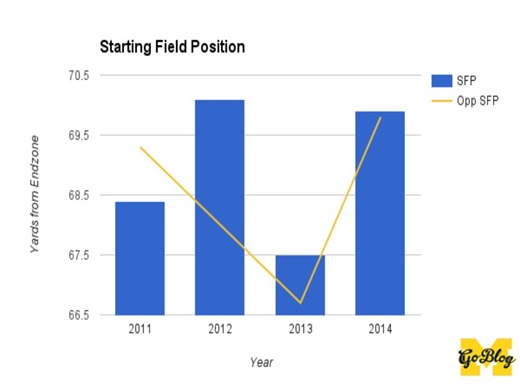
Michigan’s offense had a surprising number of opportunities that, if the above graphs are any indication, they didn’t capitalize on in 2013. They started 16.9% of their possessions with a short field and 19.5% with a long field. (Michigan’s Long Field % was 39th nationally, a sixty-spot improvement from 2012.) Inefficiency on standard downs and rushing incompetence, however, meant that only 15.9% of opponent possessions were long-field drives; this ranked 119th, nine spots away from being the worst in the nation.
That all fits the narrative of 2013, but 2012 was actually a more difficult season for Michigan in terms of field position. A look at the national ranks shows that Michigan rarely had a short field and often had a long one, while their opponents had a short field relatively often and almost never started with a long field.
| Year | ShF Rk | Opp. ShF Rk | LoF Rk | Opp. LoF Rk |
| 2010 | 56 | 91 | 96 | 113 |
| 2011 | 16 | 53 | 68 | 80 |
| 2012 | 96 | 78 | 99 | 121 |
| 2013 | 7 | 106 | 39 | 119 |
| 2014 | 60 | 121 | 11 | 61 |
The graph below nicely illustrates the disadvantage Michigan had in 2012, while also showing the advantage opposing offenses had in 2013.
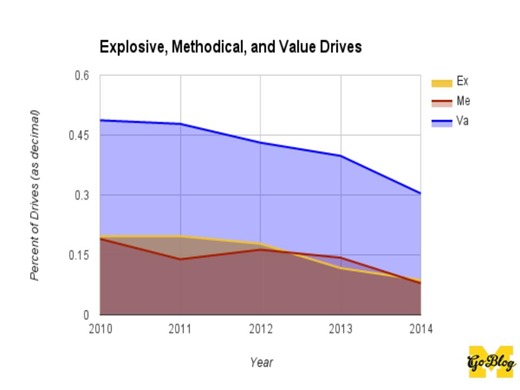
Michigan didn’t start with a short field very often in 2014, but they also rarely started with a long field. Field position doesn’t appear to hold the key to what went wrong with the offense, so we’ll transition to looking at different types of drives. More definitions from Fremeau:
- Ex: Explosive Drives, the percentage of each offense's drives that average at least 10 yards per play.
- Me: Methodical Drives, the percentage of each offense's drives that run 10 or more plays.
- Va: Value Drives, the percentage of each offense's drives beginning on its own side of the field that reach at least the opponent's 30-yard line.
We can put a bit more credence in the chuck-it-up-and-pray trope about the 2011 offense from comparing Explosive and Methodical Drives. That offense was a top-ten unit in explosiveness but ranked 56th in Methodical Drives. A high Value Drives number (22nd) shows that the 2011 offense could move the ball into opponent territory without taking a ton of plays to do so.
Hoke and Borges’ vision of an old school, three-yards-and-a-cloud-of-dust offense started to take shape in 2012. Explosive Drives declined while Methodical Drives rose; the drop in Value Drives from 22nd to 42nd, though, was a harbinger of the next two seasons.
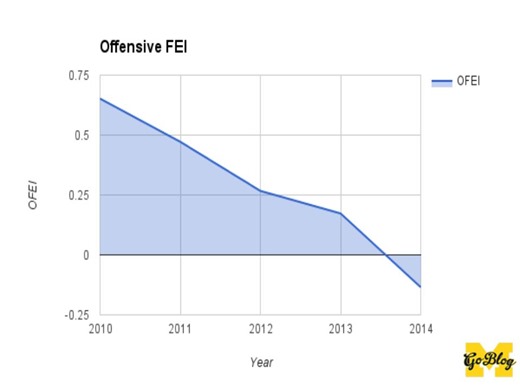
That’s, uh, not ideal.
Maybe it’ll look better if we give it some extra context by looking at the national rankings.
| Year | OFEI Rk |
| 2010 | 2 |
| 2011 | 9 |
| 2012 | 25 |
| 2013 | 42 |
| 2014 | 82 |
Ha.
Ha ha.
That’s opponent adjusted, too.
Ha ha ha.
/goes to make self cup of coffee, takes a walk in the rain
Looking at First Down Rate (% of drives resulting in at least one first down or TD) and Available Yards Rate (yards gained by the offense/total yards available based on starting field position) is in line with our move toward bigger-picture stats, but they tell essentially the same story we’ve set up above: the Hoke offenses got worse and worse with very little fluctuation in even the most specific stats. I think a table with national ranks illustrates the story of FD Rate and AY Rate better than a graph, as small year-to-year changes in percentage can result in big swings in national rank.
| Year | FD Rk | AY RK |
| 2010 | 37 | 16 |
| 2011 | 32 | 20 |
| 2012 | 48 | 45 |
| 2013 | 92 | 67 |
| 2014 | 59 | 98 |
The offense’s First Down Rate bottomed out in 2013 at 62.3% and recovered slightly to 67.5% in 2014. For additional context, Oregon’s 83.0% was the highest First Down Rate in the nation in 2014. Improvement is, uh, relative. As for Available Yards, you can see the precipitous decline. Hoke’s first offense gained nearly 55% of available yards, but by 2014 they gained just 40.1%.
**********
Is the offense what you envisioned when you first came in?"That depends. I think the basic plays of a pro-style offense are a big part of it. The play-action game, all those things. There are some things out of the spread that we're obviously going to stay with, that kind of overlap a little bit with how you want to block at the point of attack and those things. We're still going to line up and run the power play a bunch."
Brady Hoke, 8/29/11
Rushing
That took a turn toward the morbidly amusing, so let’s look at something so absymal we printed a t-shirt. That’s a depressingly earnest shirt. MGoBlog: come for the torturous reminders of the past seven years, stay for the occasional space cat picture.
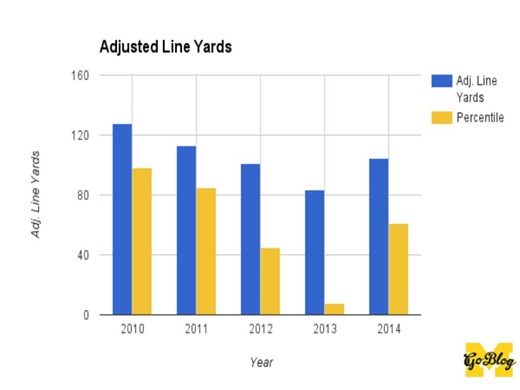
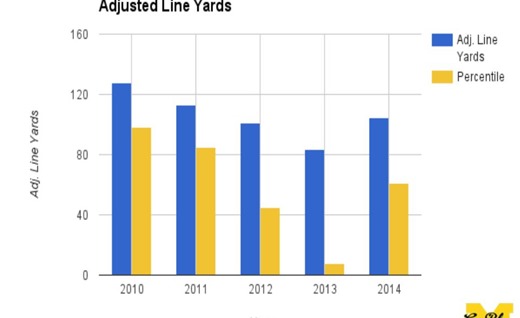
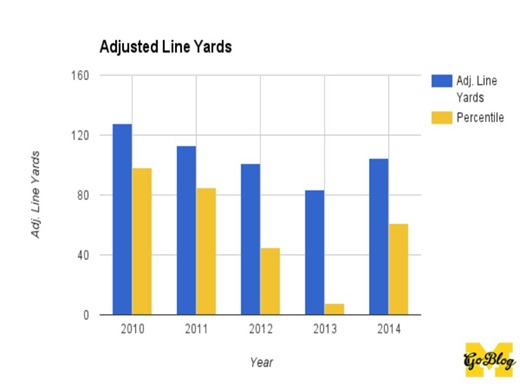
It’s not a space cat, but Michigan’s Adjusted Line Yards were at their lowest in the lineup-shuffling, confusion-addled 2013 season and then were actually not terrible in 2014. Percentile is included in the graph to illustrate just how bad things got; Michigan was in the 98th percentile in 2010 and fell to the eighth by 2013.
You should read the full definition here, but Adjusted Line Yards are an attempt to separate an offensive line’s ability from a running back’s. It’s fairly intuitive; the line gets more credit for short gains than medium gains, and almost no credit after a back is 11 yards past the line of scrimmage. These numbers are also opponent adjusted. The line went from being one of the best in the country in Rich Rodriguez’s final year to being okay in 2014, but “okay” was relatively great for the 2014 offense.
Advanced stats for running backs are difficult to use because they keep changing. Bill Connelly used to use something called Adjusted POE (points over expected), but he’s concluded that it isn’t as useful as once believed and has swapped Adj. POE out for Highlight Yards and Opportunity Rate.
The numbers that are available, however, say what you’d expect: Denard was insane and then ineffable, Devin was good and then slightly less so, and the running backs went from pretty bad to pretty alright. Even with the running backs’ improvement from 2013 to 2014, DeVeon Smith was the only back to be ranked in Connelly’s top 100 and even then he wasn’t great. Michigan’s ground game over the past four years was essentially Denard and some complementary backs, and while Devin did what he could it’s tough to replace someone whose Points Over Expected value his senior year was good enough to place in the top five since the stat was created in 2005 when your supporting cast is relatively similar.
Passing
If you look at the Passing S&P+ graph above you’ll see that Michigan’s passing game was one of the few exceptions to the Rule of Constant Decline, improving from 2011 to 2012 before slipping and falling off a cliff a la Wile E. Coyote. Passing S&P+’s national rank did decline from fourth to 13th from 2010 to 2011, but the aforementioned improvement saw them as the 11th ranked passing attack in 2012. Even in 2013, a year summed up just as much by Devin Gardner’s Notre Dame performance as his play against Akron or Michigan State, Passing S&P+ was still in the top 25 (albeit as number 25, but still). It wasn’t until 2014 that things precipitously worsened, with Passing S&P+ ranked 72nd. Michigan went from having a higher-rated passing game than almost 92% of the country to having one better than just 44% of the country in two seasons.
This deserves a closer look, so I aggregated all of the data from the last four seasons of UFR’s Hennecharts. (Here’s the chart legend.) A disclaimer: 2011 and 2012 are fully charted, but 2013 is missing the OSU and bowl game and 2014 was charted through nine games. That says as much about the program’s trajectory as anything I’ve written above. The chart shows the percentage of that year’s total charted throws:
| Yr | DO | CA | MA | IN | BR | TA | BA | PR | SCR | DSR |
| 2011 | 7.9% | 45.3% | 6.0% | 17.7% | 8.3% | 2.6% | 2.6% | 6.0% | 3.4% | 61.2% |
| 2012 | 11.4% | 44.3% | 5.8% | 11.0% | 6.4% | 4.1% | 3.8% | 6.4% | 6.7% |
71%* 67%** |
| 2013 | 10.4% | 41.2% | 4.8% | 10.4% | 6.6% | 6.1% | 1.9% | 10.1% | 8.5% | 70.9% |
| 2014 | 6.9% | 45.5% | 5.0% | 14.1% | 7.6% | 7.6% | 1.8% | 4.7% | 6.9% | 68%** 36.5%*** |
*=Denard Robinson, **=Devin Gardner, ***=Shane Morris
Dead-on passes fell to a low heretofore unseen in 2014, while inaccurate passes were at their most frequent since 2011. Even so, the quarterbacking wasn’t as bad as you might expect when Passing S&P+ is ranked 72nd. The sample size issue is probably at play here. (Not that I can blame Brian because M00N.) The 2014 numbers don’t include games against Northwestern and Maryland in which Michigan barely cracked 100 passing yards and didn’t have double-digit passing first downs, plus the 250 passing yards from The (Sports Make No Sense) Game against the Turnpike Tetrodons.
Perhaps more important than the Hennecharts is the previously graphed Passing Downs S&P+ number, which was 102nd in the nation. Inability to move the ball on passing downs leads to an inability to convert and continue drives, and that certainly was seen in Michigan’s lack of Explosive, Methodical, and Value Drives.
**********
“Well, as expected, they fired me,” he told them. “They said they did an evaluation, and they didn’t like all the ‘negativity surrounding the program.’… “It was a bad fit here from the start.”
Rich Rodriguez, as reported by John U. Bacon in Three and Out
By 2014 the offense was nothing. They couldn’t pass; they didn’t run very well; they weren’t efficient, explosive, or methodical; they didn’t have terrible starting field position (in fact, they were almost top-ten in not facing long-field drives); they couldn’t put together value drives; they were middling at picking up first downs and awful at gaining yards available to them. That offense was the equivalent of empty calories, except empty calories are fun to eat. Consuming Michigan’s 2014 offense left you with the same high blood pressure but without a single enjoyable experience to pin it on.
Brady Hoke was a good cultural fit from the start, but his on-field track record left something to be desired. Advanced offensive stats in Hoke’s first two seasons were generally favorable in large part because of Denard. What Hoke’s offenses could have been is ripe for historical revisionism because of their lack of a prevalent identity; would Hoke have been better off if he had been able to fully implement his MANBALL ideology from the beginning, or is the only reason he was able to tread water for so long because Denard bought him time?
The big question I’m left with is what came first, a poorly executed transition or a bad fit? With the numbers laid bare we can see what Michigan was bad at, and it’s pretty much everything. This is where the “what ifs” start to fly: what if Denard transferred and the MANBALL timeline was accelerated? What if Hoke and Borges never tried to put Denard under center? What if Borges understood constraint theory? What if Borges didn’t rep every blocking scheme under the sun? What if Devin Gardner never got hurt?
The numbers, of course, can’t answer those questions. What they can do is show us a true regression, a way of quantifying the misery of the past four seasons as the offense’s performance went from good to bad to baffling.
