Taco-ranked starters are far more likely than Glasgows [Fuller]
Every year, as college football recruiting becomes the only football thing left to pay attention to until spring, we are suddenly struck by an army of pundits so arrogantly attached to their "recruiting stars don't matter" narratives that they don't bother to care that math is against them.
Michigan typically gets taken to the woodshed in these articles for recurrently not matching recruiting expectations with on-field results. This discrepancy does exist beyond the normal J.T. Turners that everybody gets, and for various interrelated reasons: attrition spikes, spottily shoddy coaching, program instability, recruiting shortfalls. Anecdotally, there are examples I can point to, especially in the early aughts, when an otherwise two-star athlete was bumped to a three-star because Michigan offered. That explains less about how Wisconsin and Michigan State thrive on 2- and 3-stars, and more about how Michigan has recruited very few guys under a consensus 3-star.
However every time we find a new way to compare recruiting data to performance data, we consistently discover that recruiting stars handed out by the services correlate to better players. No, a 5-star isn't an instant superstar, but the 25-30 five-stars each season are consistently found to be about twice as likely to meet some performance metric (NFL draft, All-conference, team success, etc.) as the pool of 200-odd four-stars, who are consistently more likely to meet performance thresholds of the 400-odd three-stars, etc.
Today I present a new metric for proving it: starts.
 |
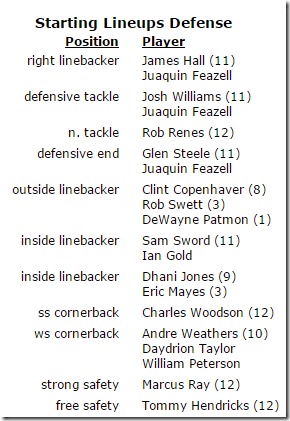
| Example of raw data, via UM Bentley Library. |
ALL the Starts
My project over Christmas was to take the data from Bentley's team pages (example at right), scrub the hell out of it, and produce a database of who started what years, at what positions, at what age, with what recruiting hype, etc.
A few weeks back I released the initial results of my starts data. We noticed there were a lot of problems in that. I went back and did a lot of fixing, mostly just finding more weird errors in the Bentley pages I'd culled the data from, sometimes emailing the guys themselves to ask things like "Was there a game in 2001 that either you or B.J. didn't start?"
I think I've got it cleaned up now; at least the total number of starts for each season matches 22 players per game.
Recruiting By Starts
Starting in 1996 we start getting relatively uniform star rankings for recruits, though I had to translate Lemming rankings and such into stars (he had position rankings and national lists that line up with what we call recruits today). So I took the average of available star ratings of all players to appear on Michigan's Bentley rosters from the Class of 1996 through the Class of 2010, and put 'em against the number of starts generated. Guess what: recruiting actually matters.
| Recruit Level | 1996-2011 Recruits | 1996-2014 Starts | Starts/ Player |
|---|---|---|---|
| 5-stars | 21 | 450 | 21.4 |
| 4.5-stars | 28 | 462 | 16.5 |
| 4-stars | 82 | 1215 | 14.8 |
| 3.5-stars | 76 | 881 | 11.6 |
| 3-stars | 82 | 669 | 8.2 |
| 2- or 2.5-stars | 29 | 271 | 9.3 |
| Walk-ons | 217 | 97 | 0.4 |
Even with Michigan's notorious luck, the 5-stars were expected to give you about two seasons of starts, compared to the 8 or 9 games you'll get out of a 2- or 3-star. That is significant, and offers a bit more evidence toward the general statement about recruiting stars: the higher the star rating, the more likely he is to be a good college football player, though at best you're at 50-50.
As for walk-ons, I've linked to the list of the 217 guys in that time period who made the Bentley rosters and weren't special teamers, in case you doubt me. The Order of St. Kovacs have accomplished great things for Michigan, but turning up one of those guys anywhere other than fullback has been rare indeed.
Best Classes
I'm going to try to use the starts data above to get predictive. The scatter plot of the 1996-2010 group was pretty linear so I'm just going to plug in a linear equation:
Expected Starts on Avg M Team = Stars x 5.30 - 6.35
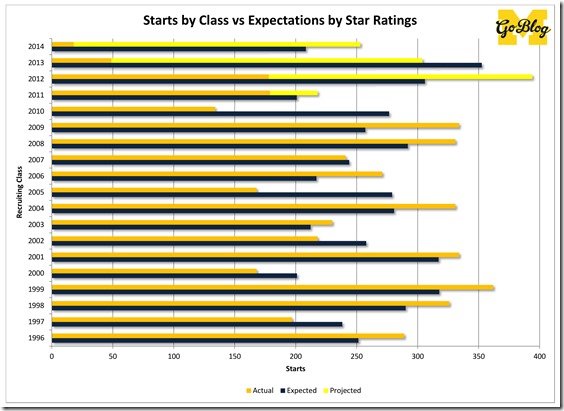
And that gives us a reasonable expectation of Michigan starts to expect from a class based on their rankings:
click big makes
For the Class of 2011-2014 projections, I just guessed by hand, so those projections are going to be increasingly inaccurate once I'm predicting 2017 starters and whatnot.
The chart above has two stories to tell: 1) The strength of a recruiting class is strongly correlated to the value that class will produce in starters, and 2) the damage done by attrition to the 2005 and 2010 classes created ripple effects for several classes afterwards.
An Average Michigan Team:
By some quick averages I was able to get an average makeup of a starting 22. I took the average number of starts by experience (i.e. year in the program) for the classes of 1995-2010, adjusted those numbers for a 13-game schedule, then divided by 13 games to get an idea of what the starters ought to be against years of interest.
| Experience | Average | 2014 | 2013 | 2012 | 2011 | 2008 | 1999 | 1997 |
|---|---|---|---|---|---|---|---|---|
| 5th Years | 5 | 3 | 5 | 7 | 4 | 4 | 6 | 3 |
| Senior / RS Jr | 7 | 5 | 4 | 8 | 8 | 6 | 8 | 9 |
| Junior / RS So | 6 | 10 | 5 | 4 | 7 | 7 | 5 | 6 |
| Soph / RS Fr | 3 | 3 | 6 | 2 | 1 | 2 | 3 | 4 |
| True Frosh | 1 | 1 | 2 | 1 | 2 | 3 | 0 | 0 |
| AVG starter age | 3.55 | 3.27 | 3.18 | 3.82 | 3.50 | 3.27 | 3.77 | 3.50 |
By this the last two teams look extraordinarily young—about as young as the 2008 team or younger. The 2012 team by contrast seems like a wasted opportunity. FWIW I counted Devin, not Denard, as the quarterback, or it would have been even older. That fits the narrative: 2012 was a wasted opportunity, as a line with three 5th year seniors (two of whom were long-term productive starters) plus Lewan and Schofield was coached into one of the worst offensive lines in memory.


