scoreboard
Last week I did the thing you're not supposed to do: I got into an argument with a Tennessee fan about conference strength. Actually it started as a conversation about how cute my 1-year-old dog is but all conversations with SEC fans are really conference strength conversations. Before the inevitable deterioration into Woodson-Manning (which is particularly impossible with him because he knew Peyton in school and has an incredible story about how nice of a guy Peyton Manning was) I thought to test his assertion that the SEC has been dominant, except for 2005, since Bear Bryant's day.
Attempting to debate this, I stumbled onto sports-reference.com's SRS statistic. It stands for "Simple Rating System" and was borrowed from the NFL guys. What it represents is how much that team should beat an average team:
So every team's rating is their average point margin, adjusted up or down depending on the strength of their opponents.
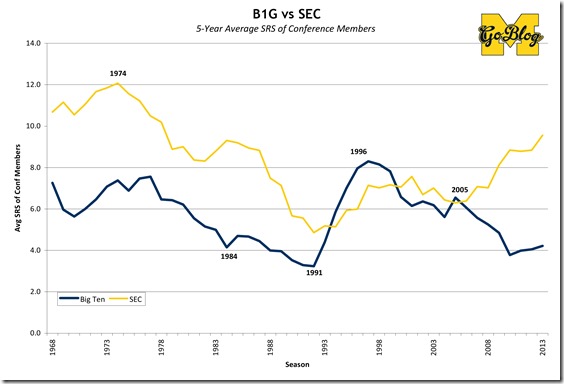
This generally works for the NFL because of relative schedule parity. But it proved useless for comparing college football teams and conferences over history because they lacked that. I'll explain why, but first lets apply SRS averages of the conferences since 1964 to our debate, which demonstrates… that I just totally screwed myself:
Cliggens embicking.
Well yeah, but we admitted this: until Penn State joined and some of the dreks got their acts together it really was the Big Two-Little 8. Let's see mostly Michigan-Ohio State against Alabama et al.:
It stayed pretty even except when Michigan wasn't good. There's a reason for that: Michigan (35 times) and Ohio State (33) teams account for over two thirds of Big Ten's 100 representatives from the last 50 years. Alabama teams are counted 28 times, with Florida (18), Tennessee (15), Georgia (12), Auburn (11) and LSU (11) all ahead of the next Big Ten team, which is Penn State (8). Until the '90s, the bottom half of the Big Ten sucked way worse than the bottom half of the SEC, according to SRS:
What really happened here: the SEC teams were playing easier schedules until the Big Ten caught on and started scheduling bodybags, and then things were even until the Big Ten started actually sucking. I explain, after the jump.
[The jump, after which I explain, as I just explained]
| Comparison of Sched makeup: 1964-2013 | ||
|---|---|---|
| Type | Bama | Mich |
| Conference Games | 362 (65%) | 397 (72%) |
| Other BCS/majors | 88 (16%) | 107 (19%) |
| Mid-majors | 94 (17%) | 47 (8%) |
| FCS/D-IAA | 13 (2%) | 4 (1%) |
| Total | 557 | 555 |
Uneven Schedules
The problem with that is they weren't playing equivalent schedules. Alabama's reputation among the SEC is they will play big games while others (looking at you, Ole Miss) constantly schedule cupcakes. Since 1964, it appears a challenging schedule for an SEC team clearly doesn't match up with the Big Ten team that used to make similar claims. A big chunk of those mid-major games were Bama's 32 years of playing Southern Miss (Michigan had 30 years of playing Notre Dame).
It could have skewed further if I chose to count Michigan's quasi-annual series (11 games from 1963-1981) with Navy as a major opponent—they certainly weren't by the time the series ended in '81, but when it started the Midshipmen were perennial powers, having lost the (de facto) national championship game to end 1963 and coming into the '64 Michigan game ranked #6 nationally (that team finished 3-6-1 and unranked).
| 1974 Opponents | SEC | Big Ten |
|---|---|---|
| Conference Games | 60 | 80 |
| Other majors | 27 (21-5-2) | 26 (14-12-0) |
| Mid-majors | 17 (16-3-0) | 3 (1-1-1) |
| D-IAA | 5 (5-0-0) | 1 (1-0-0) |
| Total | 110 | 110 |
Let's look closer that that 1974 season when the SEC reached some sort of peak (12.9 average SRS, to the Big Ten's 7.27). That's the year that Michigan beat Ohio State with a last-second field goal except it was called wide just so Michigan's seniors could get screwed once again. Since that epic stupid fuckery was allowed to stand M and OSU tied for the Big Ten championship, and Archie Griffin and co. made another undeserved trip to Pasadena, losing to USC so the Trojans could be crowned national champs by everybody but the AP, which justly chose Oklahoma.
That year SEC teams played just six conference games to the Big Ten's eight. As a result 73% of the Big Ten's games were against each other while only 55% of SEC schedules necessarily resulted in a conference loss. All but one of those conference games were replaced with body bags.
 |
| Dennis Franklin in 1974, driving toward an ultimate ref-hosing. [UM Bentley Library] |
The Big Ten's mid-majors were Navy, #10 Miami (NNTM) and Arizona, plus Minnesota played North Dakota. The SEC also caught Miami (NNTM), which beat Kentucky (they tied Purdue). The rest were Army, Houston, Louisville (x3), Memphis (x3), Southern Miss (x2), Tulane (x4), Tulsa, and Utah. To that they added games against Chattanooga and one each versus Lamar, William & Mary, and the Virginia Military Institute. None of the SEC's mid-major opponents were ranked at the time they played but a few cracked the top 25 at various points.
The SEC indeed did better against real competition—they went 21-5-2 against other majors, versus the Big Ten's 14-12-0. Even there the Big Ten's opponents were way tougher. Only five of the SEC's major non-conference foes were ranked at the time of their game, the highest #12 UCLA. The Big Ten meanwhile played national championship contenders Nebraska and Notre Dame thrice apiece plus eventual #2 USC and #7 Penn State.
It makes a huge difference. The SEC and Big Ten teams beat mid-major and lower division teams by an average score of 32-13 as opposed to 22-18 versus major conference foes, but SRS treats them as the same.
Also making a difference, probably, was the tendency of crotchety Woody Hayes acolytes who peppered the Big Ten keeping scoring margins artificially low by grinding away the end of games, running out 4-point victories as gentlemen do. The did this, and it bit them on occasion, so I don't know how to calculate it. Perhaps percentage of all points (for example a 13-10 win counts as much as a 52-40 one) instead of scoring margin?
I don't know hot to fix it without downloading all of their data. But average SRS is a useless stat.


